House Turnover Rates Explained
One common misperception about Congress is that there is almost no turnover among its members. Many people imagine the House and Senate as a bunch of old guys who have been in office forever. You may have heard the stat that 96% of members get re-elected, or seen reelection rates charts for past years.
While it is true that member reelection rates are typically in the mid-90s, that stat is very misleading if you are considering turnover. This is because it does not count members who do not seek reelection. Members leave Congress for all sorts of reasons: electoral defeat, retirement, the pursuit of higher office, and death. And one set of members who voluntarily retire are those who come to believe they are going to lose their reelection; no one wants to spend the time and energy it takes to run a congressional race if they believe that they are going to lose. As such, the 96% reelection stat both understates total turnover in Congress and overstates incumbent security.
In reality, 50 or more new freshmen members join the House at the beginning of a typical Congress. For example, there were 52 new representatives in the 115th Congress (a turnover rate of approximately 12%). Similarly, there were 60 new representatives in the 114th Congress (14% turnover). And there were 72 new representatives in the 113th Congress (16% turnover).
The turnover rate at the beginning of the 116th Congress is already poised exceed these levels; there are 72 members currently serving in the 115th Congress who will not be in the 116th Congress. Given the number of incumbents in toss-up seats, it’s not hard to imagine 90 or more new members of the 116th House (a 20% turnover rate). Of course, even that wouldn’t be all that unusual. There were 94 new representatives in the House at the beginning of the 112th Congress (2011-2012).
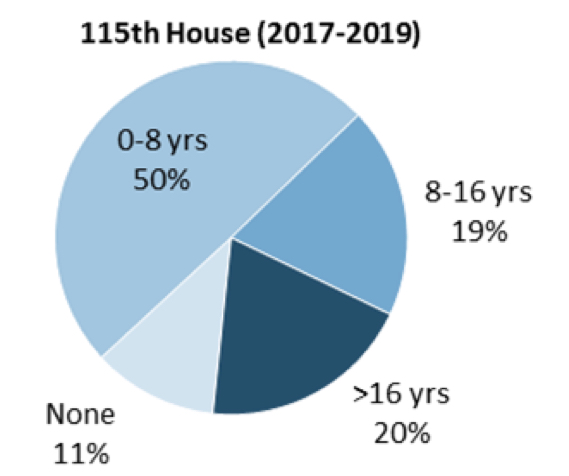
One upshot of this higher-than-popularly-believed turnover is that most members of Congress have served less time than most people believe. At the outset of the 115th Congress, the average representative had 9.4 years of experience, just under five terms; 61% of the representatives had served 4 complete terms or less. The chart below shows a breakdown of the average tenure among currently serving representatives as of the first day of the 115th Congress (Data from my CRS report on the topic.)
The consequences of this are important. Sometimes we talk about Congress getting back to “regular order,” particularly in the context of the appropriations process. But the appropriations process hasn’t functioned in any way close to something you might call regular order since at least FY2010, the last time an individual appropriations bill went through the committee process, floor, conference, and was signed into law as a stand-alone measure prior to October 1. Significantly, FY10 was 9 years ago. More than half of the members currently serving in the House were not in office then. Consequently, they have no direct experience with an appropriations process that wasn’t dependent on continuing resolutions and omnibus appropriations bills. Josh Huder put it well on Twitter yesterday:
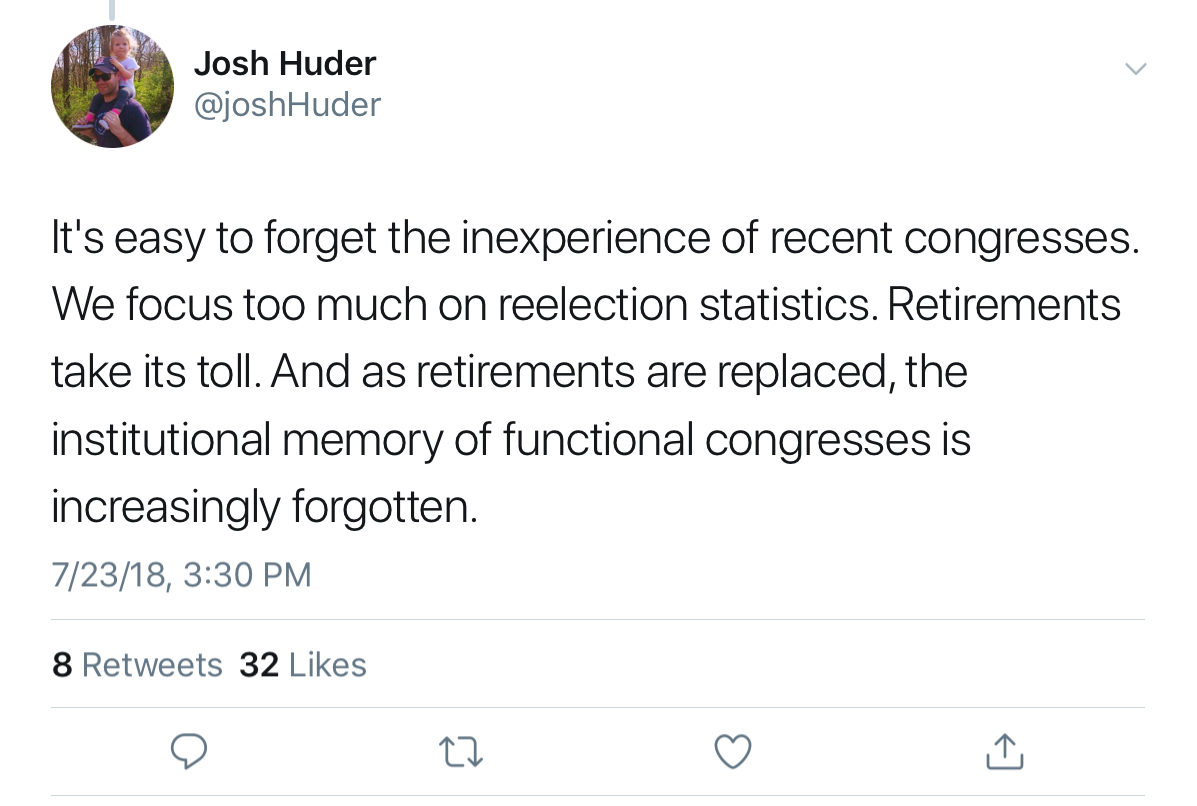
Talking to these members about regular order is akin to showing them a history book, not reminding them of a process in which they participated. For the majority of the House, regular order is the dysfunctional appropriations process under which they currently live.
A second consideration is historical. Has turnover in Congress changed over time? Indeed, it has. Here is some relevant data from my CRS report. First, the average service experience of members, by Congress:
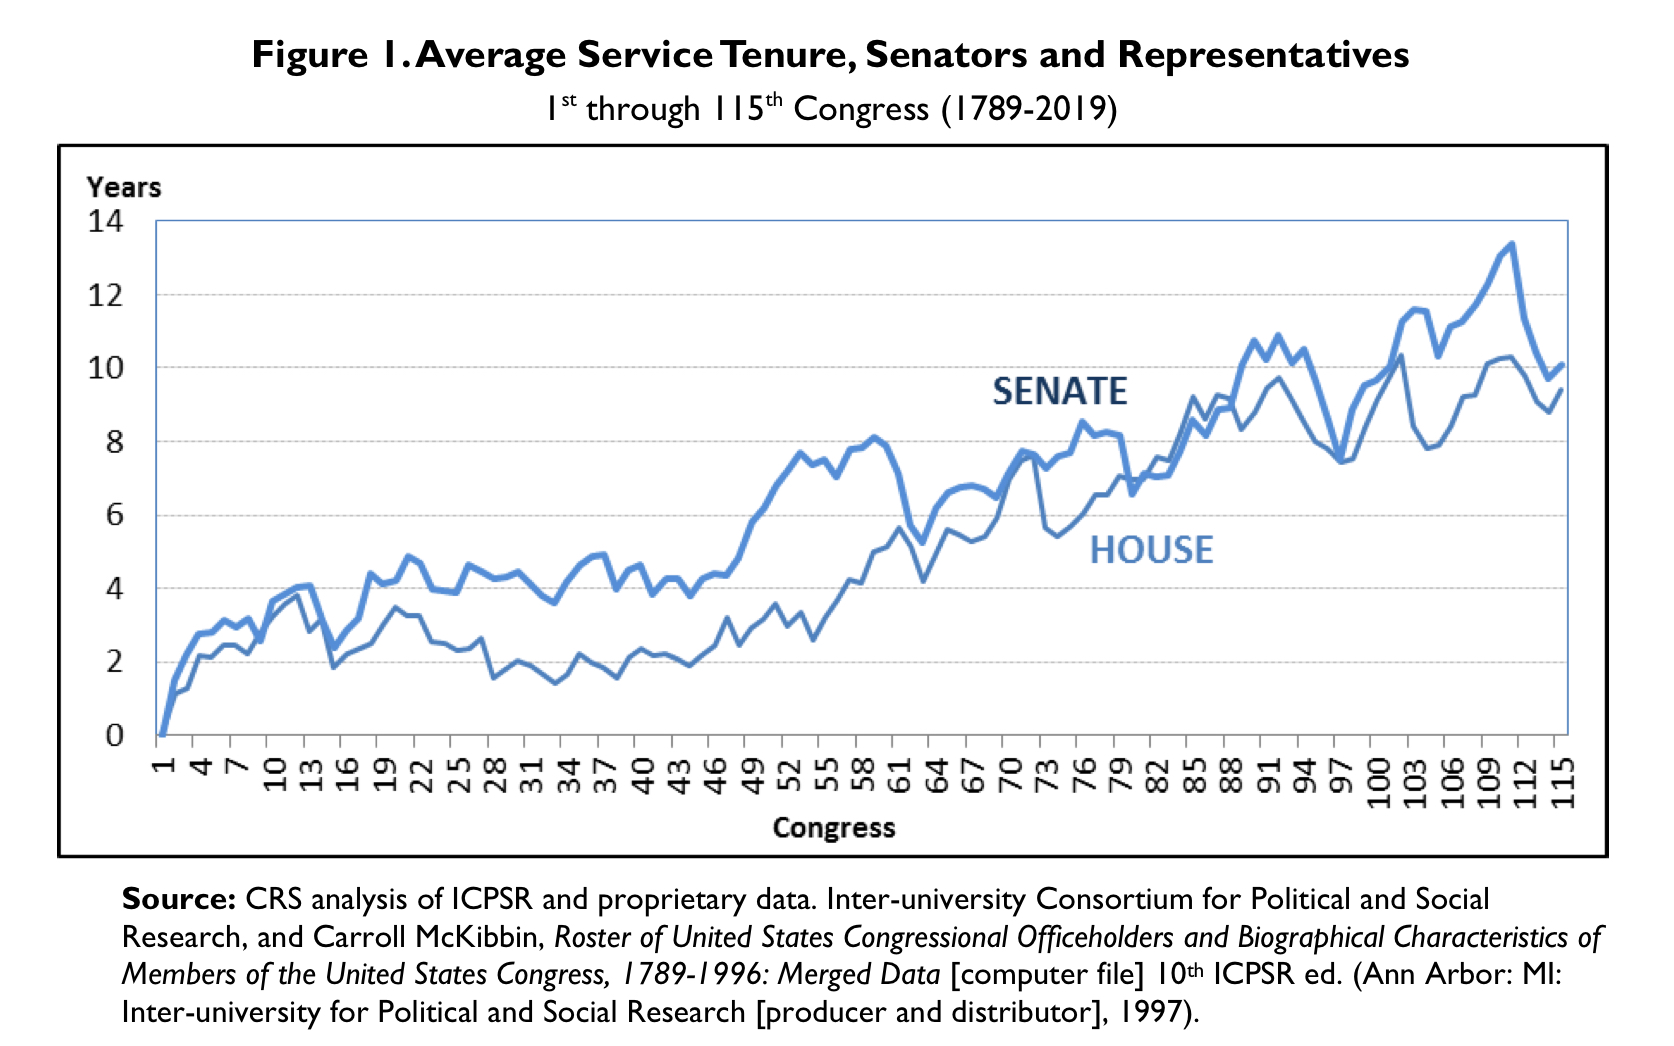
As you can see, average service tenure in Congress has increased over the course of American history, in both the House and Senate. But most of the increase occurred between the latter half of the 19th century and the middle of the 20th century. Since the 88th Congress (1963-1964), average tenures have not grown much at all.
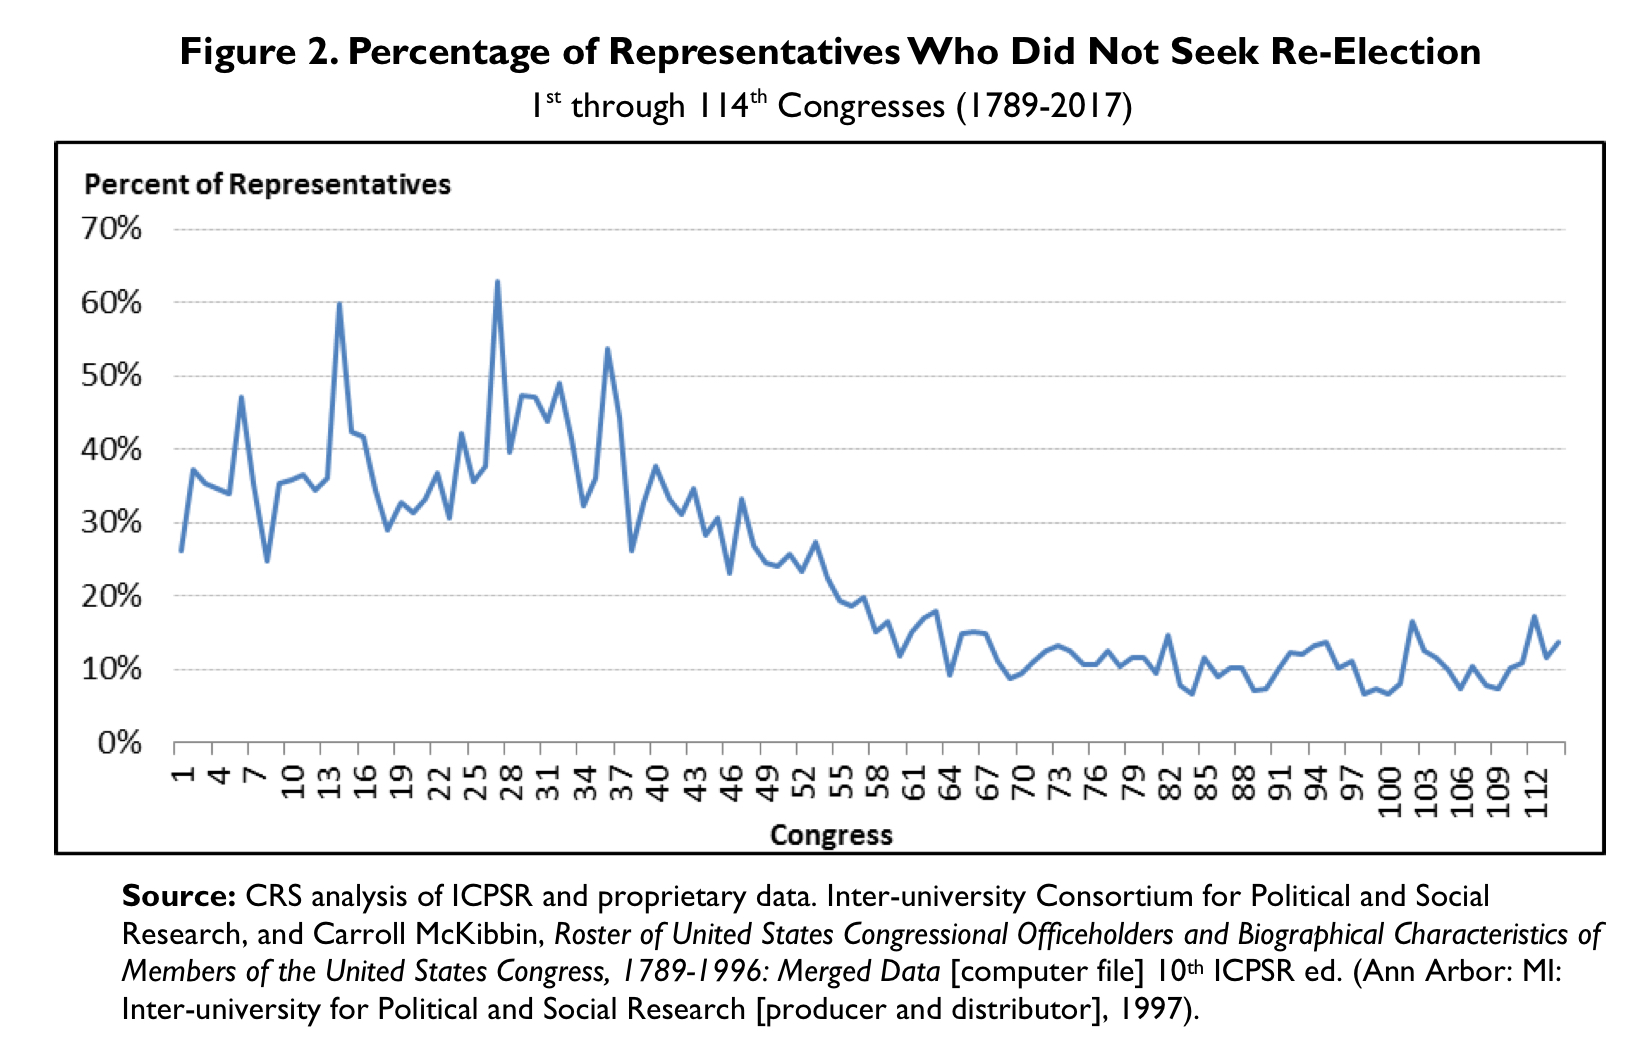
You can think of average service tenure as the composition of two variables: the percentage of members who seek reelection, and the reelection rate of those who do. The chart below shows the percentage of representatives by Congress who did not seek reelection for whatever reason (retirement, seeking other office, death, etc.). As you can see, it has been stable since the early 20th century. During the 19th century, a large percentage of members did not seek reelection. Following a steady decrease after the civil war, the rate stabilized in the 20th century, with an average of 11% of representatives not seeking reelection.
The defeat rate for incumbents shows a different historical trend, rising steadily in the first half of the 19th century, stabilizing (with large variation) between the civil war and World War II, and then falling dramatically. As shown, however, there is still large variation, conforming to our sense of wave elections in 1994 and 2010.

Finally, this last figure shows the experience composition of the House of Representatives at four different points in history.
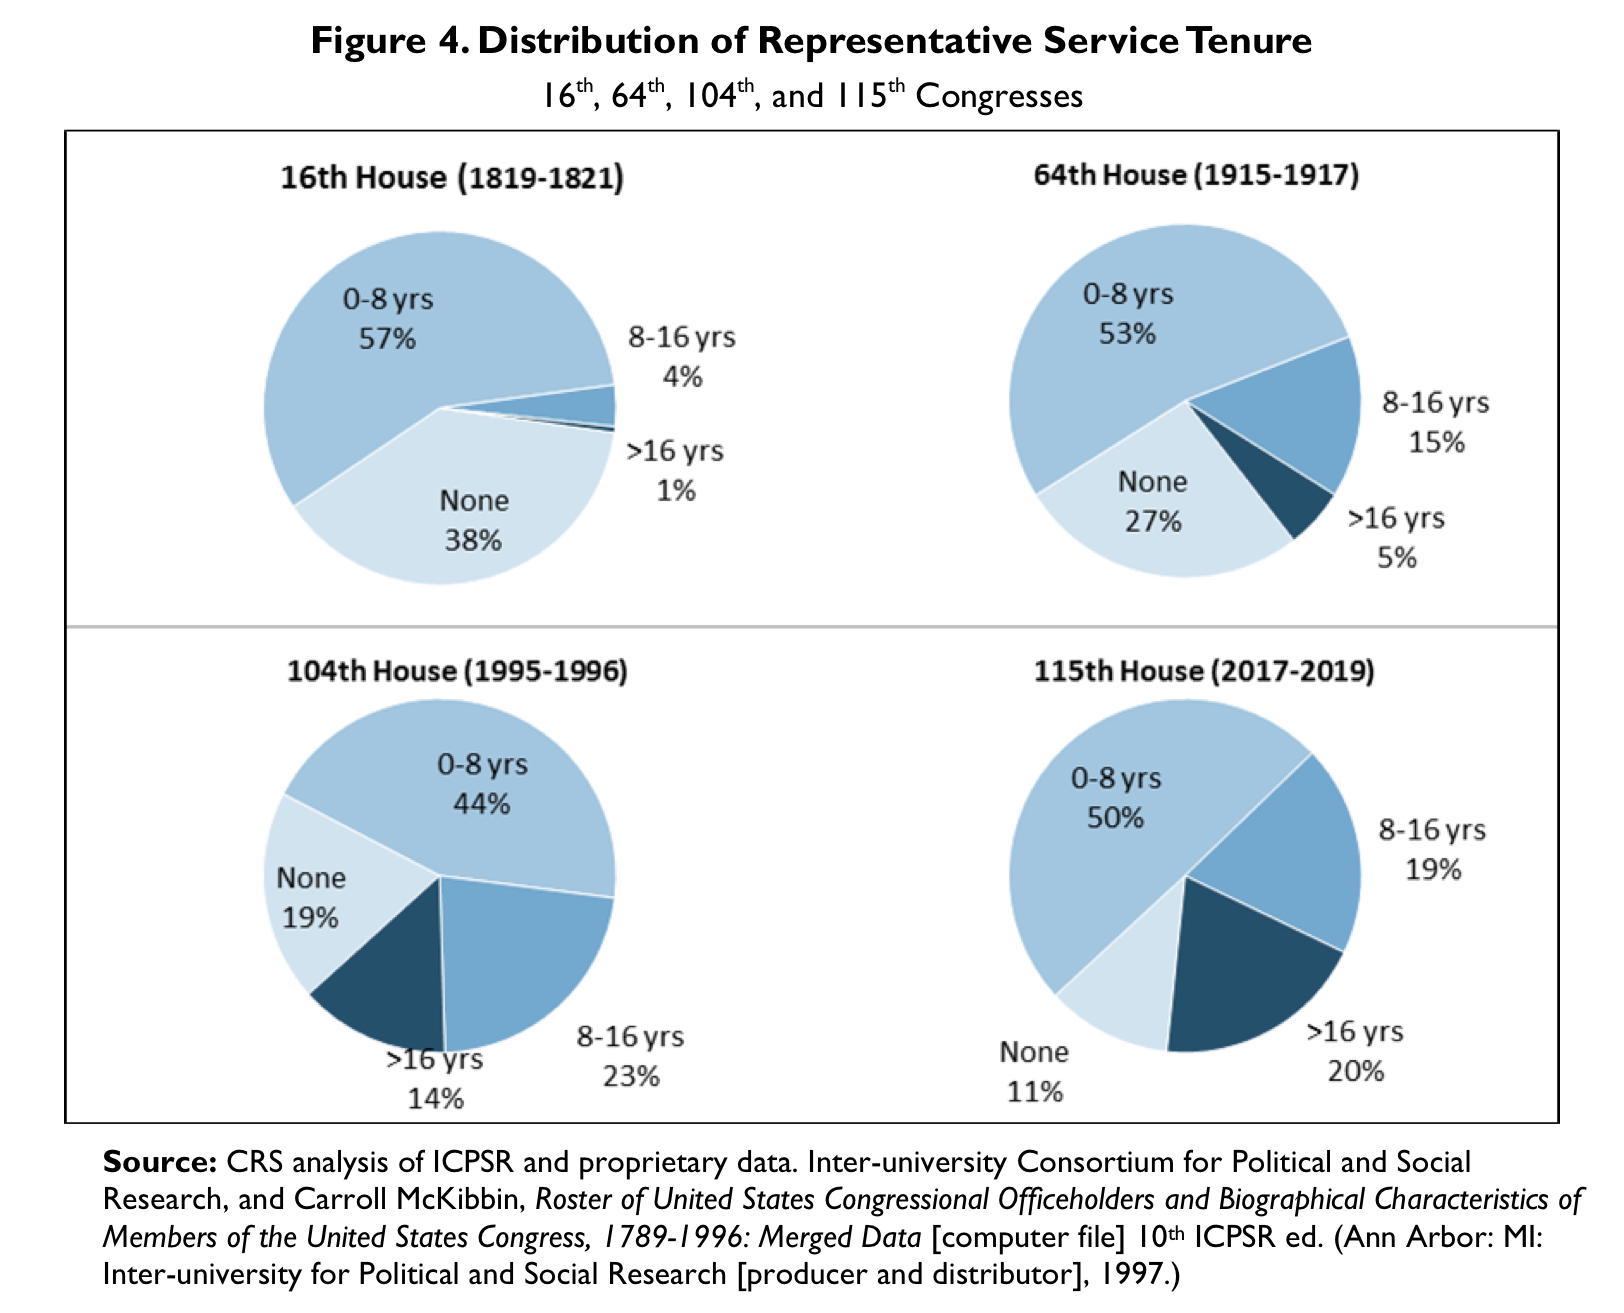
As we would expect given the rates of members seeking reelection and the reelection success rate, the proportion of representatives with more than 8 years experience in the House is much higher now than in the early 20th century or early 19th century.